Diario de Notícias
-
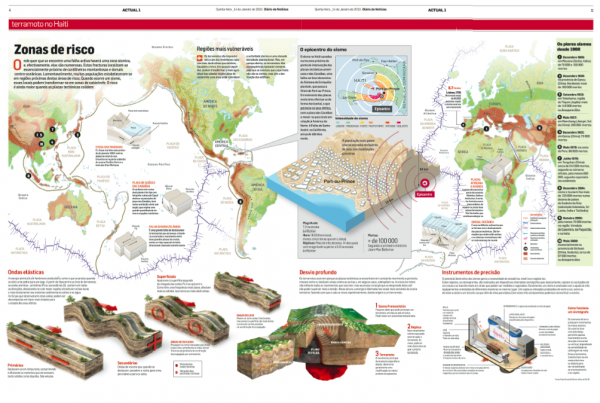
Haiti Earthquake
This graphic explanation of the tragic earthquake in Haiti, is a brilliant example of a graphic adaptation of various scientific infographics for a current event, this one occurred on January 12th, 2010. The infographic, published by the Portuguese newspaper Diário de Notícias, shows which regions of the planet are the most affected by seismic movements, what types of waves an earthquake produces, why it occurs and how its intensity is measured.
Page(s): 4-5