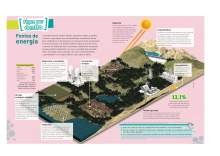
Petroleum, coal, natural gas, hydroelectric, solar, geothermal, wind, nuclear, biofuel and even wastes are energy sources represented in the Fontes de Energía (Sources of energy) infographic, published in the Fique por dentro (Look inside) section of the Tempo de Ciências (Science Time) book of 9th year of Basic Education II. Editora do Brasil added a table with the world energy supply.
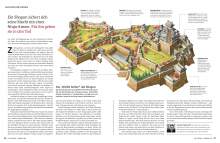
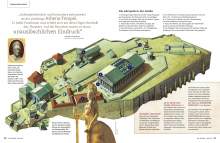
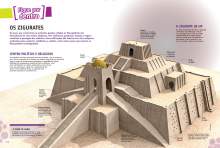
The ziggurat, the unique stepped temple of the Mesopotamian civilization, appeared among the infographics of the 6th year textbook Tempo de Historia (Time of History), published by Editora do Brasil. Unlike others inserted in the textbooks of the São Paulo publishing house, the original infographic did not undergo transformations. Page(s): 108-109
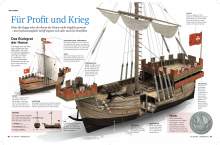
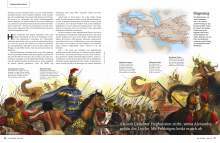
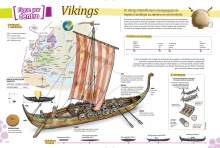
Viking navigators, merchants, conquerors and pirates also landed in the Fique por dentro (Look inside) section of the 6th year Tempo de Historia (History Time) manual. Editora do Brasil recomposed the original infographic, to which he added images and graphics of his own creation, with a remarkable result. Page(s): 294-295
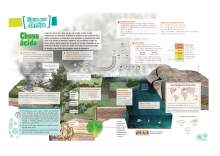
The causes and effects of acid rain, an environmental phenomenon that destroys vegetation as a result of air pollution by gases of industrial origin, were exposed in the Tempo de Ciências (Science Time) 9th year textbook, published by of Editora do Brasil, in the Fique por dentro (Look inside) section, dedicated to infographics. The initial layout of texts and graphics was visibly modified by the client.