How customers use our infographics

Infographics90 shows a selection of how our infographics have been used by clients since 2010, and how the elements that appear in them have been treated and accommodated to their editing needs.

Publication date: 
Monday, 1 February, 2016
Publication date: 
Tuesday, 1 December, 2015
Publication date: 
Monday, 2 November, 2015
Publication date: 
Tuesday, 1 September, 2015
Publication date: 
Friday, 1 May, 2015
Publication date: 
Monday, 2 February, 2015
Publication date: 
Monday, 2 February, 2015
Publication date: 
Monday, 2 February, 2015

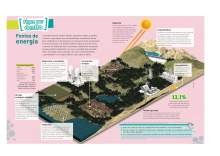
Petroleum, coal, natural gas, hydroelectric, solar, geothermal, wind, nuclear, biofuel and even wastes are energy sources represented in the Fontes de Energía (Sources of energy) infographic, published in the Fique por dentro (Look inside) section of the Tempo de Ciências (Science Time) book of 9th year of Basic Education II. Editora do Brasil added a table with the world energy supply.

Publication date: 
Monday, 2 February, 2015
Publication date: 
Monday, 2 February, 2015

The ziggurat, the unique stepped temple of the Mesopotamian civilization, appeared among the infographics of the 6th year textbook Tempo de Historia (Time of History), published by Editora do Brasil. Unlike others inserted in the textbooks of the São Paulo publishing house, the original infographic did not undergo transformations.
Page(s): 108-109

Pages